
The application scenario of AI in medical treatment is very complex and very important, including the diagnosis, prediction, treatment and management of diseases. Some people feel that “people who engage in artificial intelligence technology do not know what is important and solvable in medical care, and those who engage in medical care do not know how well the technology can helpâ€, said the former IBM Cognitive Medical Research Director and Ping An Medical Technology Research. The vice president of the hospital, Dr. Xie Guofan, brought detailed explanations on the core concepts, main methods and development trends of disease prediction technology.
Last year, I wrote "Application Scenarios and Key Technologies I Appreciate" that was originally planned to write a "drama" and many things have been delayed. A year has passed since then, and now the second article, concept, methods and trends of disease prediction technology has been introduced. The core concepts, main methods and development trends of the disease prediction technology mentioned in the previous article have been analyzed.
The core concept of disease prediction
The problem solved by the core of disease risk prediction is to predict the probability of an individual suffering from a disease (or some event) in a certain period of time in the future. The disease prediction will set a specific time window for a certain target, such as stroke, heart failure, death, etc., according to a certain population definition, such as the entire population, atrial fibrillation population, and in-hospital infarction population, including making predictions. The time point, and the time window to be predicted, predict the probability of the target's occurrence.
Disease prediction using real-world data faces some of the following technical challenges:
Poor data quality: Many fields in electronic medical record data are missing, leading to the inability to extract key features; there are even unintentional or intentional input errors that cause noise in data analysis.
High data dimension: The medical data relates to the patient's conditional complaint, past medical history, family genetic history, personal history, physical examination information, diagnosis, examination, examination, medication, and surgery. Each patient's data in a disease registry often reaches 2000 dimensions, and the real electronic medical record data even reaches tens of thousands of dimensions. Such high-dimensional, sparse data poses a challenge for prediction.
Data sequence: The patient will have continuous medical records for a period of time, such as multiple records during hospitalization, or multiple outpatient visits within one year. If it comes to real-time data collected by wearable devices, it is changing every minute. In order to better refine the prediction signal from the data, the time series information of the data must be analyzed and mined.
Unbalanced data: The incidence of many diseases is not high. For example, the average probability of stroke in patients with atrial fibrillation is 10%, and the average probability that stroke patients cause disability after discharge is 4%. There are relatively few positive cases in the data, which are very unbalanced and require higher machine learning algorithms.
The main method of disease prediction
The main methods of disease prediction can be simply divided into three categories: classical regression methods, machine learning methods, and deep learning methods. Below, we will use three papers as an example to introduce.
Disease Prediction Based on Classical Regression Methods
Traditional disease risk prediction is mainly based on the Cox proportional hazards regression model (Cox model for short) and logistic regression model. For example, [Wang et al. 2003] published an article in JAMA that uses the Cox model to establish a risk prediction model for stroke and death in patients with atrial fibrillation based on the Framingham heart study. The process flow is shown in Figure 1. The study used data from the patient's most recent examination prior to the diagnosis of atrial fibrillation as the baseline data for the risk factors. The starting point of the observation was the diagnosis of atrial fibrillation with an observation time window of 10 years. Based on the previous study of stroke prediction in atrial fibrillation, two very important continuous variables, namely age and systolic pressure, were put directly into a multivariate model. Other risk factors were determined using stepwise regression. Variables meeting the test criteria P<0.10 were included in the model, including taking antihypertensive medication, having a history of myocardial infarction or congestive heart failure (before definitive AF), having a stroke, or History of transient ischemic attacks (before confirmation of AF), smoking, left ventricular hypertrophy as judged by electrocardiogram, diabetes, and clinical valvular heart disease.

Figure 1 Prediction of Stroke and Death Risk Based on Cox Regression
The statistical analysis method of this study [Wang et al. 2003] used the Cox proportional hazards model, a semi-parametric regression model proposed by the British statistician DR Cox. The model uses survival outcomes and survival time as dependent variables. It can analyze the impact of multiple factors on survival at the same time. It can analyze data with censored survival time, and does not require the estimation of the type of survival distribution of the data. The Cox model has been widely used in medical research and is the most widely used multi-factor regression analysis method in traditional survival analysis and risk prediction.
The evaluation of the stroke prediction model takes into account the calibration and discrimination. The calibration degree refers to the degree of agreement between the predicted results and the actual results, and is evaluated by Hosmer-Lemeshow (HL) statistics; the discrimination degree is calculated by c-statistics, that is, under the receiver operating characteristic curve (ROC curve). Area (AUC). The HL statistics for the stroke prediction model and stroke or death prediction model were 7.6 and 6.5, respectively, the AUC for the stroke prediction model was 0.66, and the AUC for the stroke or death prediction model was 0.70.
Disease prediction based on machine learning methods
Although traditional regression methods have a wide range of applications in disease prediction, these methods still have room for improvement in terms of prediction accuracy and model interpretability. In recent years, feature selection and supervised learning modeling methods in machine learning are increasingly used for disease prediction. Some machine learning methods can improve the interpretability of predictive models, such as decision tree methods. On the other hand, some newer machine learning methods can lead to better predictive performance.
The article published in KDD in 2010 [Khosla et al. 2010] used feature selection and machine learning methods to predict the incidence of stroke within 5 years. The data from this study comes from the Cardiovascular Health Study (CHS) dataset and is primarily targeted at people over 65 years of age. This data records nearly 1,000 attributes of 5021 patients from 1989 to 1999, including medical examinations, questionnaires, and telephone contact. After the pretreatment, the final data set included 4,988 samples, of which 299 individuals had strokes and contained a total of 796 features. The data was randomly divided into a 9:1 training set and a test set. At the same time, the proportion of positive and negative samples was kept unchanged. The method flow is shown in Figure 2.

Figure 2 Prediction of Stroke Risk Based on Machine Learning
The study used four methods for missing value filling, including mean filling, median filling, linear regression, and expectation maximization; there were three feature selection methods, including forward feature selection, L1 regularization, and conservative mean feature selection. (μ - σ); Supported vector machines (SVM) and edge-based censored regression methods were attempted during modeling. Using L1 regularized logistic regression for feature selection and then using SVM for prediction, the average test AUC with 10-fold cross-validation was 0.764, superior to the L1 regularized Cox model. The average of the combination of various feature selection algorithms and prediction algorithms shows that the conservative mean and edge-based censored regression combined to achieve 0.777 in the AUC evaluation criteria are the best performance results.
Disease prediction based on deep learning method
In recent years, the rapid development of deep learning technology has caused disruptive changes in many areas such as image recognition, speech recognition, and natural language understanding. For the analysis of electronic medical record data, some studies have also used deep learning methods to establish disease risk prediction models, using CNN or RNN models.
[Cheng et al. 2016] Based on EHR data of more than 300,000 patients for 4 years, the CNN network is used to predict future events. The key issue in the study is how to establish an effective model based on the previous time series data of electronic health records and predict the risk probability of the patient's disease. The dataset of this study was derived from 319,650 patients with a 4-year real electronic health record and collected data on chronic heart failure (CHF, congestive heart failure) and chronic obstructive pulmonary disease (COPD, chronic obstructive pulmonary disease), including CHF test data. The set included 1127 positive patients and 3850 negative controls; the COPD test data set included 477 positive patients and 2385 negative controls. The study used convolutional neural network (CNN) as a supervised learning model. First, each patient's electronic health record data was simplified to be mapped into a two-dimensional EHR matrix. The vertical axis represents the type of patient's clinical event, corresponding to the ICD-9 code. The horizontal axis represents the time of the patient's clinical event and is measured in days. Considering the characteristics of the EHR matrix, the study builds a convolutional neural network model based on the following assumptions: 1) hypotheses that there are no correlations between clinical events; 2) correlations of the same clinical events in time; 3) timing of admission to different patients Different lengths are reflected in the inconsistent size of the EHR matrix. The article finally adopted a four-layer convolutional neural network model of INPUT-CONV-POOL-FC. The method flow is shown in Figure 3 below.
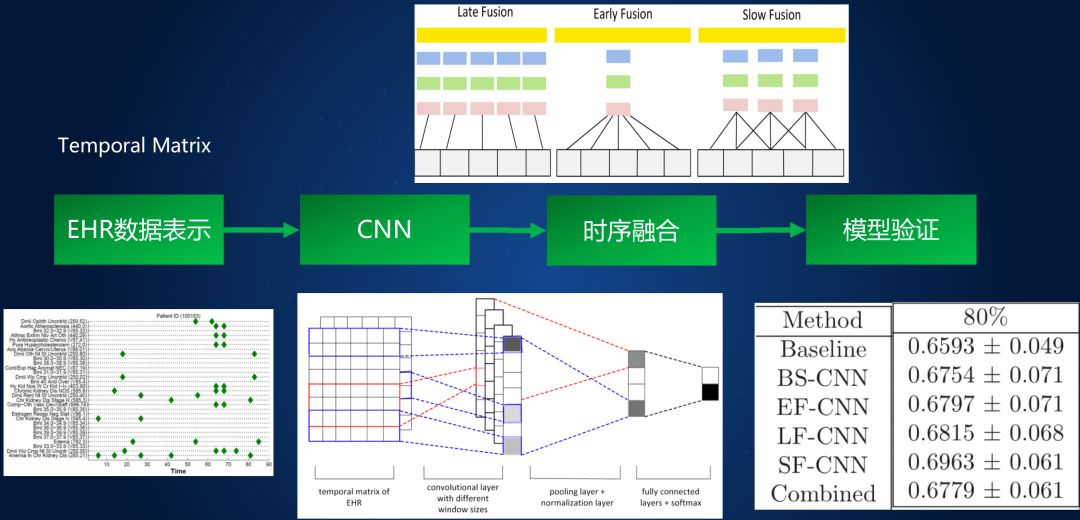
Figure 3 Convolutional neural network model
Because the patient's electronic health record matrix is ​​variable, it is divided into different sub-matrices along the time axis, and then features are extracted for each sub-matrix first, and then the features of different sub-matrices are integrated. According to the different steps of segmentation, extraction and integration, this study used several different integration methods, and then compared the predictive performance of different methods on the test data sets of chronic heart failure and chronic obstructive pulmonary disease. Finally, it was found that SF-CNN, a hybrid strategy of comprehensive segmentation, extraction, and integration, performed best.
At present, more people try to use RNN (Recurrent Neural Network) method to analyze the temporal relationship before clinical events in electronic medical records. [Chio et.al 2016] took the lead in using the RNN-based method for predicting heart failure (HF), based on 3884 positive cases and 28,903 negative cases, spanning from May 2000 to 2013 May a total of 3 years. The modeling of a single clinical event uses the one-hot vectors commonly used in natural language understanding. Any clinical event is represented as an N-dimensional vector, but the last bit of the vector is the interval between the event occurrence time and the prediction time. , similar to a timestamp. Then, a GRU (Gated Recurrent Unit) is used to calculate the corresponding implicit state from each input clinical event vector, and a logistic regression model is applied to the final hidden state to calculate the final HF risk probability. Compared with the classical regression or machine learning methods such as LR (Logistic Regression), SVM and KNN, it is found that the prediction of AUC based on RNN method is improved.
Disease prediction technology summary
From the above analysis of classical regression methods, machine learning methods and deep learning methods, we can find that the necessary components of disease prediction technology include several key steps such as data completion, feature representation, feature selection, and predictive modeling. .
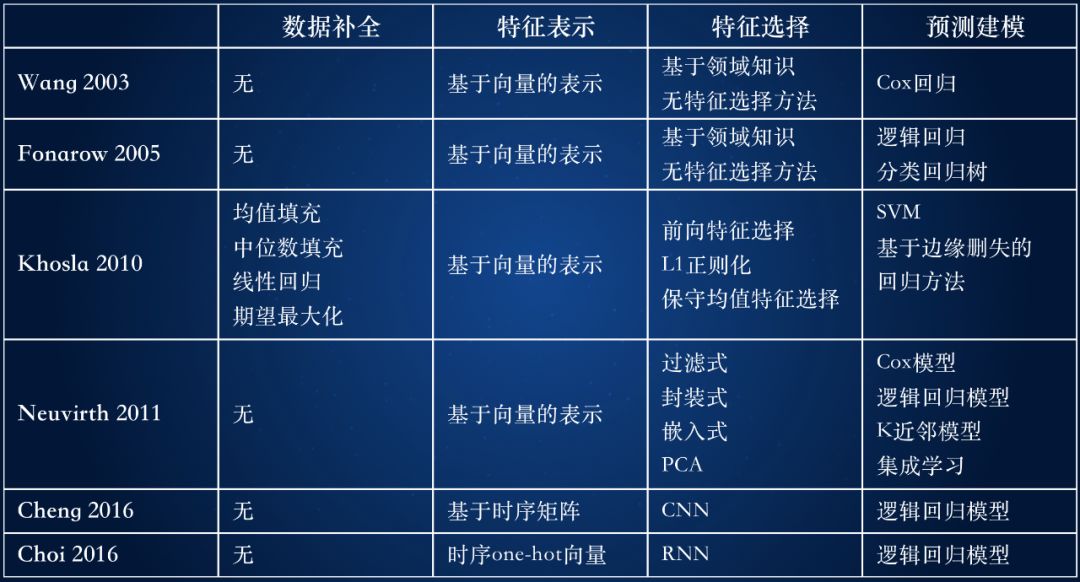
Table 1 Comparison of disease prediction methods
It can be seen from:
The method of predictive modeling does not have much breakthrough in itself: In addition to [Khosla et al. 2010] blending features of SVM and Cox regression to invent a regression method based on edge censorship, most work innovations focus on feature representation and Feature selection.
Patient characteristics change from vector-based representations to time-series matrices: classical machine learning and statistical methods generally use vector-based representation methods, and use multiple feature selection algorithms to extract the most predictive features. The latest deep learning method uses a time-series matrix or timing vector method to capture the timing signals in real-world data as much as possible.
Deep learning method has changed the feature extraction method, but it has reduced the interpretability: In the feature selection, the original features are transformed by multiple layers using CNN or RNN methods, and the original features are mapped into new spaces to improve the classification ability. But it also reduces the interpretability of the model.
The trend of disease prediction technology
The research of disease prediction technology can focus on the following two points:
Predictions based on multimodal data: Medical data is multimodal, containing structured data, text, images, and streaming data (heart rate, blood oxygen, respiration, etc.). The current forecasting method mainly deals with structured data. If features in text, video, or streaming data are needed, the required features are first extracted from these unstructured data by some methods. How to process multi-modal data and perform fusion and prediction with multiple end-to-end networks is an important technical challenge.
The fusion of medical domain knowledge and machine learning methods predicts: In the current disease prediction methods, medical domain knowledge and machine learning methods are fragmented. The classical statistical method is based on the selection of features to be selected manually based on knowledge in the medical field. Then, the statistical method is used to calculate the importance of each feature and a prediction model is constructed. The method of machine learning is based entirely on data. It does not refer to the known risk factors and weights accumulated in the past several decades in a forecasting field, nor does it pay attention to the interpretability of the model. It uses methods of feature representation and extraction. Automatically extract features from massive data and build models. How to effectively integrate medical domain knowledge and machine learning methods, and construct interpretable prediction models are important directions for future technological innovation.
Finally, thanks to Wan Hao, Jia Wenxiao and Li Fei for their contribution to this article, but also to all readers who have the patience to read this article.
What is a miniature slip ring? Miniature slip rings are rotary electrical connectors that allow power and data to be transferred between a stationary and rotating structure. They are often used in medical, military, and aerospace applications where size and weight are critical factors.
A miniature slip ring typically consists of two parts: a stationary housing and a rotating contact assembly. The contact assembly contains the brushes that make electrical contact with the rotating structure, as well as the rings that conduct current or data.
The housing can be made from any number of materials, including metals, plastics, and composites. It is typically designed to be as small and lightweight as possible while still providing adequate strength and durability.
The contact assembly is made from precious metals such as gold or silver in order to provide good electrical conductivity.
Technology improves with the continuous development of precision machinery. The more sophisticated the equipment, the smaller the volume will be. And the space that can be accommodated for installing the slip ring is also very small. The key parts of some equipment are quite a district. Especially in the high-end military, aerospace and aviation fields. 360-degree rotation is required to transmit current and signals. And the installation space is greatly reduced. It is to make the equipment work more smoothly. Therefore, it is necessary to design the slip ring to be small and exquisite. Otherwise, it won't meet the needs of the installation.
At the same time, we have moved with the continuous development of science and technology. Various high-end precision instruments have been developed. It requires the slip ring to transmit the current amount of general power. Also often undertake the transmission of weak electrical signals and various weak signals. The transmission medium is wider, and the number of loops of the slip ring is increasing.

Miniature Slip Ring,Slip Ring Parts,Slip Ring Type Induction Motor,Slip Ring Rotor
Dongguan Oubaibo Technology Co., Ltd. , https://www.sliprob.com