Deep learning has always been viewed as a "black box" that is difficult to explain. On the one hand, it lacks mathematical elegance, lacks support from basic theories, and on the other hand lacks explanation in engineering. Its potential safety hazards have always been criticized by people. Therefore, how to better visualize CNN has always been the focus of attention in academia and industry. This article presents the latest review of CNN's visual understanding and highlights the highlights.
Currently, academia has proposed a lot of work related to visualization of CNN. In the early stage of research, visualization mainly focused on low-level features. With the rapid development and implementation of CNN, visualization has been extended to explain CNN's overall working mechanism. These tasks are mainly explained from the perspective of network structure, algorithm implementation and semantic concept. Here are some representative methods:
1. Erhan et al. proposed Activation Maximization to explain the traditional shallow network. Later, Simonyan et al. further improved this method by visualizing the maximum activation of individual CNN neurons into an input image pattern. A lot of work subsequently appeared to be based on this method, and then extended with different regular terms to improve the interpretability of the composite image mode.
2. Mahendran et al. proposed that Network Inversion reconstructs input images based on multiple neuron activations to illustrate the integrated feature maps learned by each CNN layer, revealing the internal features of the CNN network at the network layer level. Network Inversion reconstructs the input image from the original image in the feature map of a particular layer, which reveals the image information saved by that layer.
3. We did not choose to reconstruct the input image for feature visualization. Zeiler et al. proposed the Deconvolutional Neural Network based Visualization (DeconvNet) method. This method uses the DeconvNet framework to map the feature map directly to the image. Dimensions, using deconvolution CNN structures (consisting of deconvolution and deconvolution layers), look for image patterns in specific neuron-activated raw input images. Through direct mapping, DeconvNet can highlight which patterns in the input image activate specific neurons, thereby directly linking the meaning of neurons and input data.
4. Zhou Blei et al. proposed Network Dissection based Visualization, which explains CNN from a semantic perspective. By referring to a heterogeneous image dataset - Borden, Network Dissection can effectively partition an input image into multiple parts with various semantic definitions, and can match six semantic concepts (such as scenes, targets, parts, materials, textures, and colors) ). Since semantics directly represent the meaning of features, the interpretability of neurons can be significantly improved.
Below, we will introduce these four representative methods in detail.
å¯è§† Visualization through Activation Maximization
Activation Maximization (AM) was proposed to visualize the preferred input of neurons in each neural network. The preferred input can indicate the features that the neuron has learned. These learned features will be represented by a comprehensive input pattern that can maximize the activation of neurons. To synthesize such an input pattern, each pixel of the CNN input will be iteratively changed to maximize the activation of neurons.
The idea behind AM is intuitive, and its basic algorithms were also proposed by Erhan et al. as early as 2009. They visualized the preferred input mode of hidden neurons in Deep Belief Net and the Stacked Denoising Auto-Encoder learned in the MNIST digital data set.
Later, Simonyan et al. used this method to maximize the activation of CNN neurons in the output layer. Google also synthesized a similar visualization model for their Inception Network. Yosinksi et al. further used AM for large-scale applications to visualize any neuron at each level of the CNN. Recently, a lot of optimization work has been carried out on the basis of this idea to improve the interpretability and diversity of the visualization model. Through all these work, AM has shown a good ability to explain the choice of neurons and determined the hierarchical features that CNN learned.
Input layer network visualization

Visualizing CaffeNet's input layer network via AM
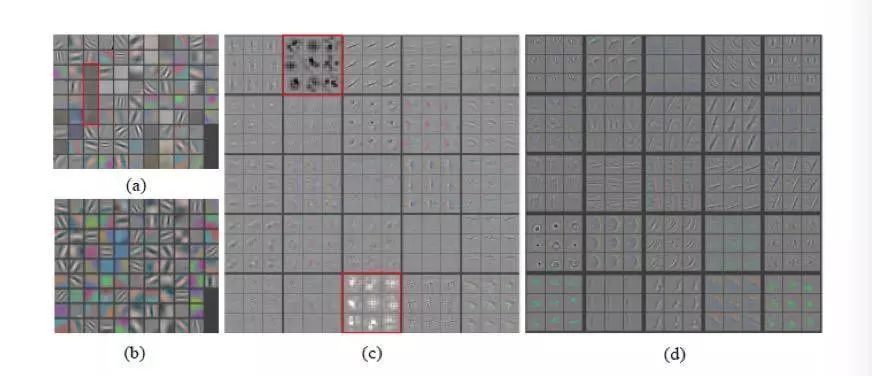
(a) shows the visualization of different patterns for the synthesis of four different neurons;
(b) The figure shows the visualization pattern synthesized by AM and direct mapping methods. As we can see, most of the visualizations synthesized by AM are almost identical to the corresponding direct mappings.
Visual patterns can be divided into two groups:
1) The color mode represents that the corresponding neuron is very sensitive to the color components in the image to be measured;
2) Black-and-white mode means that the part of neurons is very sensitive to shape information.
In addition, AM can accurately reveal the preferred input for each neuron by comparison with the direct mapping method.
This intriguing discovery reveals CNN's attempt to mimic the human visual cortex system, in which neurons in the underlying visual area are more sensitive to basic patterns such as colors, edges, and lines.
Hidden layer network visualization
Visualize CaffeNet's hidden layer network via AM
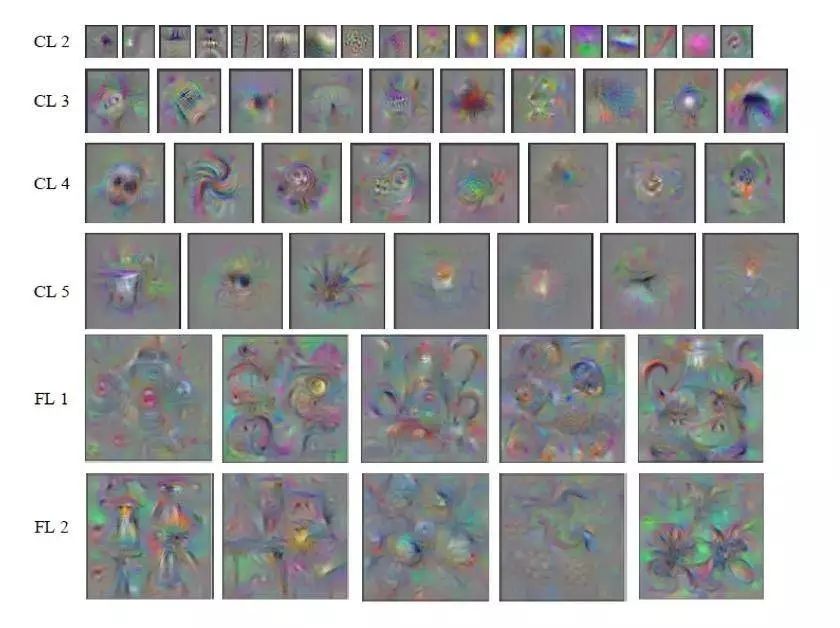
From the figure we can see the visualization of 6 hidden layers from the second convolution layer (CL 2) to the second full-connection layer (FL 2) in each row. We randomly selected several neurons in each layer as our AM test targets. It can be observed:
1) Some important patterns are visible, such as edge (CL2-4), face (CL4-1), wheel (CL4-2), bottle (CL5-1), eye (CL5-2), etc. They show The rich features learned by neurons.
2) At the same time, not all visualization modes are interpretable even if multiple regularization methods are applied.
3) The complexity and variation of visualization patterns have gradually increased from lower to higher levels, indicating that neurons learn more and more invariant features.
4) From CL 5 to FL, we can see that there is a large increment of mode change, which may indicate that the FL layer has a more comprehensive assessment of features.
Output layer network visualization
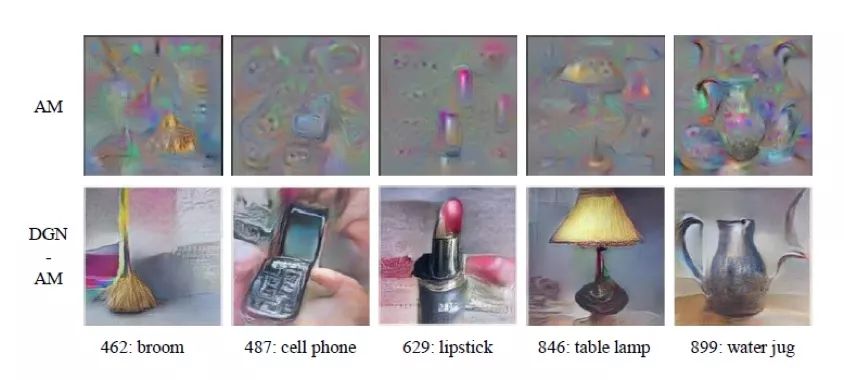
Visualize CaffeNet's output layer network via AM
The figure above shows the visualization of the synthesis of five items in FL3 by AM and DGNAM. For the effect of the first row of AM, although we can guess which category the visualization pattern represents, there are multiple repeated and blurred objects in each visualization pattern, such as in the third column (AM-3). Three lipsticks, and the picture is far from photorealistic.
For the DGN-AM shown in the second row, the DGN-AM greatly improves the image quality in terms of color and texture by using the generator network. This is because the fully connected layer contains information from all areas of the image, and the generator network provides a strong bias for actual visualization.
Through the output layer visualization, we can clearly see which target combinations may affect the CNN classification decision. For example, if CNN classifies cell phone images held by human hands into mobile phones, it is not clear whether this classification decision has been influenced by manpower. Through visualization, we can see that mobile phones and people are in this category. Visualization shows that CNN has learned to detect two target information in one image.
summary
As the most intuitive visualization method, the AM method shows that CNN can learn to detect important features such as faces, wheels, and bottles without manually specifying them. At the same time, CNN tried to imitate the hierarchical organization of the visual cortex and succeeded in constructing a hierarchical feature extraction mechanism. In addition, this visualization method shows that a single neuron will extract features in a more localized manner than distributed, and each neuron corresponds to a particular pattern.
å¯è§† Visualization through Deconvolutional Network
Finds the selective pattern that activates specific neurons in the convolutional layer from a given input image.
Activation Maximization explains CNN from a neuron perspective, while the CNN-based Deconvolutional Network (DeconvNet) interprets CNN from the perspective of the input image. It finds from the input image the selective patterns that activate specific neurons in the convolution layer. The pattern is reconstructed by mapping the feature map of the low-dimensional neurons to the image dimension.
This mapping process is implemented by the DeconvNet architecture. DeconvNet architecture performs inverse calculations of the convolutional and pooling layers through deconvolution and anti-pooling layers. DeconvNet-based visualization is not a purely analytical feature of neurons, but a more direct feature analysis at the image level.
The study of DeconvNet structure was dominated by Zeiler et al. They first proposed the DeconvNet structure, which aims to capture some of the general characteristics of reconstructing natural images by mapping highly diverse low-dimensional feature maps into higher dimensions. Later, they used the DeconvNet structure to hierarchically decompose images so that they can capture image information at all scales from the low-level edge to the high-level target portion.
In the end, they used the DeconvNet structure to explain CNN visualization by explaining CNN hidden features, which made it an effective way to visualize CNN.
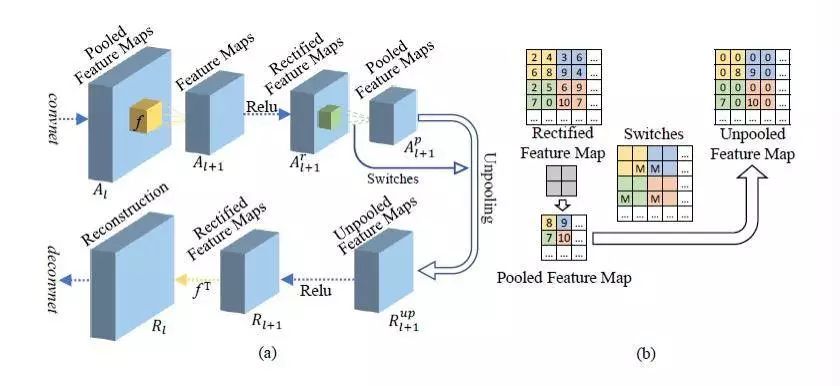
Network structure of Deconvolutional Network
Based on the inverse structure formed by these layers, DeconvNet can visualize CNN well. The visualization process can be described as follows:
(1) When processing a specific input image through CNN, this network can capture the feature map of all neurons.
(2) The network will select the feature map of the target neuron for visualization, while setting the feature map of all other neurons to zero.
(3) In order to obtain the visualization pattern, DeconvNet maps the feature map of the target neuron back to the image dimension.
(4) In order to visualize all neurons, the process is applied repeatedly to all neurons and a set of corresponding pattern images for CNN visualization is obtained.
These visualization patterns can indicate which pixels or features in the input image contribute to the activation of neurons and can also be used to examine CNN design defects.
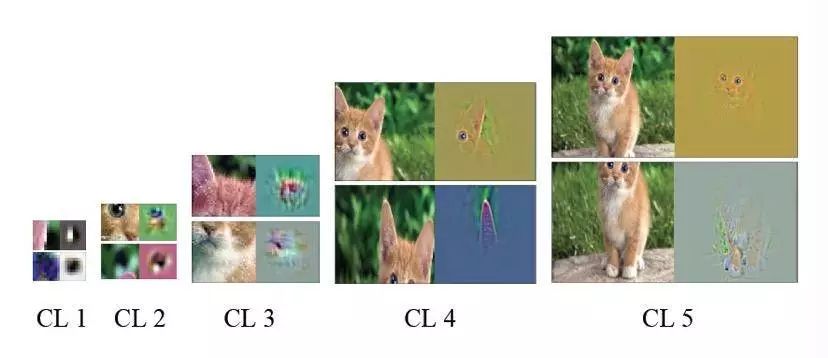
Visualize CaffeNet with DeconvNet
The image above is a DeconvNet-based visualization example that contains five convolutional layers of CaffeNet from CL1 to CL5. In each layer, we randomly selected the visual patterns of two neurons to compare with the corresponding local regions in the original image. From these examples, we can see that each individual neuron extracts features in a more localized manner and that different neurons in each layer are responsible for different modes such as mouth, eyes, and ears. The lower layers (CL1, CL2) capture small edges, corners, and parts. CL3 has more sophisticated invariability and can capture textures and similar grid patterns. The higher levels (CL4, CL5) are more categorical and can show almost the entire goal.
Compared with Activation Maximization, DeconvNet-based visualization can provide a more explicit and direct mode.
DeconvNet Network Visualization for Network Analysis and Optimization
Layer 1 (Input Layer) and Layer 2 Visualization of AlexNet and ZFNet Networks
In addition to the visualization of convolutional layers for interpretation analysis, DeconvNet can also be used to examine CNN designs for further optimization. Figures (a) and (c) above show the visualization of AlexNet's first and second layers. we can find out:
1) There are some "dead" neurons in the first level without any specific pattern (in pure gray), which means that they are not activated for input, which may be a manifestation of high learning rate or weight initialization is not very good .
2) The second layer visually shows aliasing artifacts that are highlighted with a red rectangle, which may be due to the larger step size used in the first layer convolution.
These results from visualization can be well applied to CNN optimization. Therefore, Zeiler et al. proposed ZFNet, which reduced the size of the first-layer filter and narrowed the AlexNet's convolution step, thus retaining more features in the first two convolutional layers.
Figures (b) and (d) show the improvements introduced by ZFNet, which shows the visualization of the first and second layers of ZFNet. We can see that the patterns in the first layer become more unique, while the patterns in the second layer have no aliasing artifacts. Therefore, visualization can be effectively applied to CNN analysis and further optimization.

Characteristics evolution during training ZFNet
In addition to CNN network optimization, interpretability analysis can also help monitor the CNN training process for better training efficiency.
The figure above shows the visualization mode during ZFNet training. Each row represents a different neuron in the convolutional layer. Each column is a subset of visualization patterns randomly selected at different training periods. we can find out:
1) In each line, the color contrast is artificially enhanced with the training process.
2) The lower layers (CL1, CL2) will converge quickly because different patterns appear in several periods.
3) However, these high-level patterns (CL4, CL5) require significant periods of time before they occur, which means that these layers need to be trained until they fully converge.
In addition, if the noise pattern is observed during the training, it may indicate that the network training time is not long enough, or the regularization intensity is low, resulting in overfitting of the training results. By visualizing features at several points during training, we can identify design flaws and adjust network parameters in a timely manner. In general, visualization of the training process is an effective way to monitor and evaluate the state of training.
summary
DeconvNet highlighted which of the selected patterns in the input image can contribute to the activation of neurons in a more interpretable way. In addition, this method can be used to check CNN optimization problems. Training monitoring can provide a better reference for CNN research when adjusting training parameters and stopping training. However, both of AM and DeconvNet's methods only visualize CNN at the neuron level, lacking a comprehensive perspective from higher levels of structure (such as the network layer and the entire network). In the following sections, we will further discuss high-level CNN visualization methods that can explain each individual network layer and visualize information captured by a group of neurons in the entire network layer.
å¯è§† Visualize with Network Inversion
The images of all neuron feature maps are reconstructed in any layer to highlight the integrated CNN layer-level features of a given input image.
Unlike activation from a single network of neurons, hierarchical activation can reveal a more comprehensive representation of features that are composed of all neuronal activation patterns within a layer. Therefore, unlike previous visualization of CNN activation from a single neuron, Network Inversion-based visualization can be used to analyze activation information from a hierarchical perspective.
Prior to the use of Network Inversion for CNNs visualization, traditional computer vision representation studies have proposed the basic ideas of Network Inversion, such as Directional Gradient Histogram (HOG), Scale Invariant Feature Transform (SIFT), and Local Binary Descriptors. (LBD) and visual word bag description model. Later, researchers proposed two Network Inversion scenarios for CNN visualization:
1) Network Inversion based on regularization: proposed by Mahendran et al. It uses gradient descent and regularization to reconstruct the image of each layer.
2) Network Inversion based on UpconvNet: It was proposed by Dosovitskiy et al. The images were reconstructed by training a dedicated UpconvNet.
In general, the main goal of both algorithms is to reconstruct the original input image from the specific activation of a complete network layer feature map. Network Inversion based on regularization is easier to implement because it does not require the training of additional private networks. While UpconvNet's Network Inversion requires additional dedicated networks and higher computational costs, it can visualize more higher-level information.
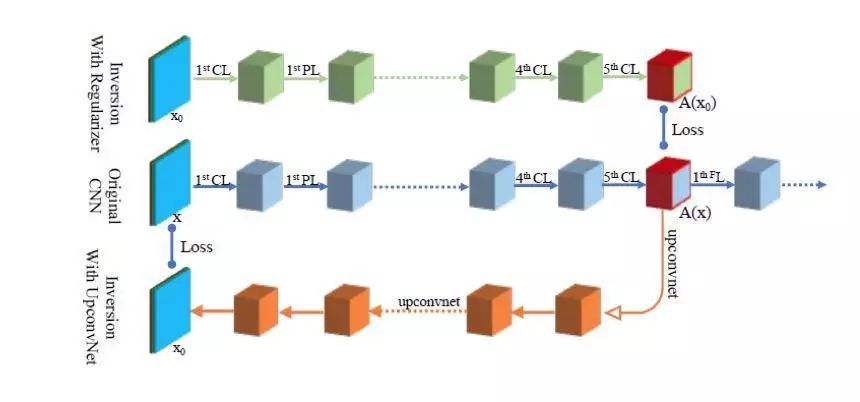
Data Flow for Two Network Inversion Algorithms
The figure above shows two Network Inversion based visualization method network implementations compared to the original CNN: Network Inversion based on regularization is indicated above in green, Network Inversion based on UpconvNet is shown below in orange, and original CNN is in the middle Expressed in blue.
Network Inversion based on regular items has the same architecture and parameters as the original CNN prior to visualizing the target layer. In this case, the algorithm adjusts each pixel of the image x0 to be reconstructed to minimize the target loss function error between the target feature map A(x0) of x0 and the feature map A(x) of the original input image x.
Network Inversion based on UpconvNet provides a reverse path for the feature map return image dimension. The algorithm adjusts the parameters of UpconvNet to minimize the target loss function error between the reconstructed image x0 and the original input image x.
Network-level visualization analysis
The visualization of the network layer can reveal the features retained by each layer. The following figure shows the visualization of the Regularizer and UpconvNet methods at AlexNet layers.
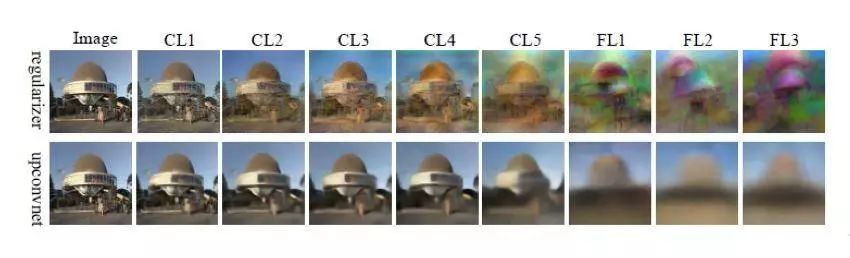
Rebuild AlexNet with Network Inversion based on regular terms and UpconvNet
From the above figure we can find:
1) Although the visualization from the CL is relatively vague, it still looks very similar to the original image. This indicates that lower level features can retain more detailed information, such as the color and location of the target.
2) A significant drop in visual quality has occurred from CL to FL. However, visualization of advanced CL and even FL can save color (UpconvNet) and approximate target position information.
3) Visualization quality based on UpconvNet is better than that based on Regularizer, especially FL.
4) The irrelevant information gradually transitions from the lower level to the higher level.
Network level feature map analysis
Based on network-level analysis, we can further leverage the Network Inversion-based visual analysis of signature features. Dosovitskiy et al perturb some of the features in the layer and reconstruct images from these perturbation feature maps. Perturbations are performed in two ways:
1) Binarization: The symbols of the values ​​of all feature maps are retained and their absolute values ​​are set to fixed values. The Euclidean norm of these values ​​remains unchanged.
2) The value of the Dropout: 50% feature map is set to zero and then normalized to maintain its Euclidean norm.
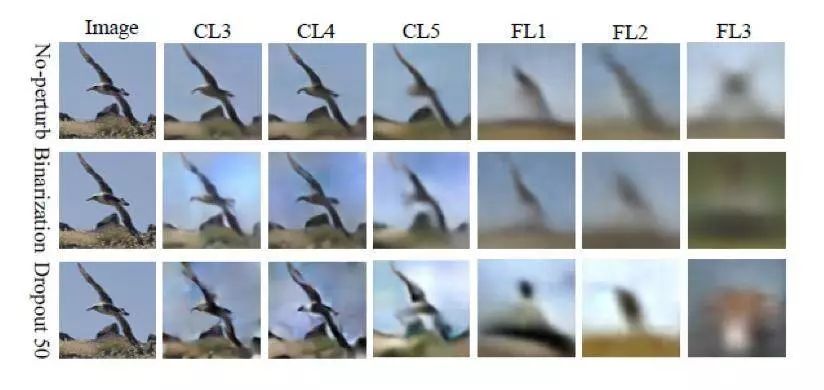
ALexNet reconstruction through perturbation feature maps
The above figure shows the reconstructed images of the two perturbation methods under different layers. From the figure we can see:
1) In FL1, binarization hardly changes the reconstruction quality, which means that almost all information about the input image is contained in the pattern of the non-zero feature map.
2) Dropout changes the size of the reconstructed image. However, experiments by Dosovictin et al. have shown that by discarding the 50% least important feature map, the reconstruction error can be significantly reduced, which is better than most layers that do not use any Dropout. These observations can prove that many CNN compression techniques can achieve optimal performance, such as quantization and filter pruning, due to the large amount of redundant information in each layer. Therefore, Network Inversion-based visualization can be used to evaluate the importance of feature mapping and cut out the least important feature mapping for network compression.
summary
Visualization based on Network Inversion projects the feature map of a particular layer onto the image dimension, allowing you to gain insight into the features retained by a particular layer. In addition, by perturbing some visual feature maps, we can verify that CNN keeps a large amount of redundant information in each layer, thus further optimizing the CNN design.
å¯è§† Visualize with Network Dissection
The relevance between each convolutional neuron or multiple neurons is assessed using specific semantic concepts.
The multiple visualization methods we introduced in the previous section revealed a visually perceivable pattern of a single neuron or captureable layer. However, there is still a gap between visual perceivable patterns and clear interpretable semantic concepts.
Therefore, Bau et al. proposed the Network Dissection. It directly associates each convolutional neuron with a specific semantic concept such as color, texture, material, component, object and scene. The correlation between neurons and semantic concepts can be measured by specific semantic concepts to find neurons that respond strongly to specific image content. Heterogeneous image data sets - Borden provides images with specific semantic concepts that correspond to local content.
The following figure shows a set of Broden examples where the semantic concept is divided into six categories highlighted with red boxes. Each semantic category can cover various categories such as plants, trains, and so on. In the lower right corner of each example in the figure below, there are also semantically-identifying neurons. We can also see that the black mask covers image content that has nothing to do with the specified semantics. Network Dissection recommends generating these black masks.
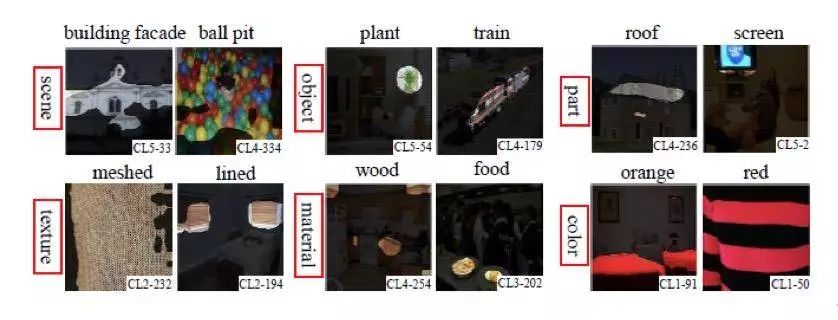
BroNet images of certain neurons activated in AlexNet
The development of Network Dissection gradually connected semantic concepts to different component levels in CNN. Network Dissection's basic algorithm illustrates the correlation between a semantic concept and a single neuron. This correlation is based on the assumption that each semantic concept can be assigned to a single neuron.
Later, further Network Dissection work showed that the features can be distributed, which indicates that a semantic concept can be represented by a combination of multiple neurons. Therefore, Fong et al. proposed another Network Dissection method, Net2Vec, which visualizes semantic concepts based on neuron combinations.
Both of these methods can provide comprehensive visualization of CNN hidden neurons.

Network Dissection diagram for measuring the semantic calibration of neurons in a given CNN
Network Dissection of a single neuron
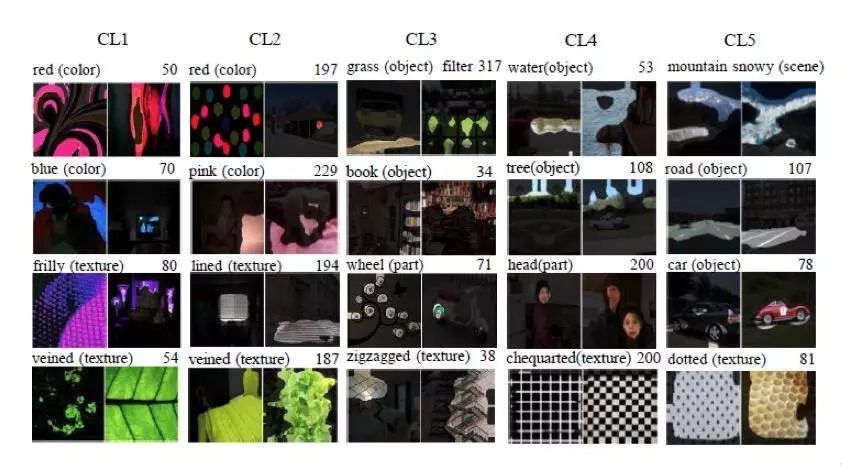
AlexNet Visualization via Network Dissection
The individual neuron visualization results are shown below. In each column, four separate neurons and two Broden images are shown in each CL. For each neuron, the upper left corner is the semantic concept of prediction, and the upper right corner represents the number of neurons.
From the figure, we can find:
1) Each image highlights areas of the real image that cause high neural activation.
2) The forecasting tag closely matches the highlighted area.
3) From the numbers summarized by the detectors, we can see that the color concept dominates at the lower levels (CL1 and CL2), while there are more target and texture detectors in CL5.
Compared with previous visualization methods, we can find that all layers of CNN neurons can detect information, not just underlying neurons, and information such as color and texture can be preserved even in higher layers because these Many color detectors can also be found in layers.
Explainability under different training conditions
Training conditions (such as the number of training iterations) may also affect CNN representation learning. Bau et al. evaluated the interpretability effects of various CNNs models using different training conditions such as Dropout, batch normalization, and random initialization. In the right part of the figure below, NoDropout represents the baseline model - Dropout in AlexNet's FC layer is removed. BN indicates that batch normalization applies to each CL. Repeat1, repeat2, and repeat3 represent random initialization weights with the number of training iterations.
We can observe:
1) The network shows similar interpretability under different initialization configurations.
2) For networks that do not use Dropout, there will be more texture detectors but fewer target detectors.
3) Batch normalization seems to significantly reduce interpretability.
Overall, Dropout and batch normalization can improve classification accuracy. From a visual point of view, in the absence of Dropout, the network tends to capture basic information. And batch normalization may reduce feature diversity.
Through this evaluation, we can find that Visualization based on Network Dissection can be effectively applied to the evaluation of different CNN optimization methods from the perspective of network interpretability.
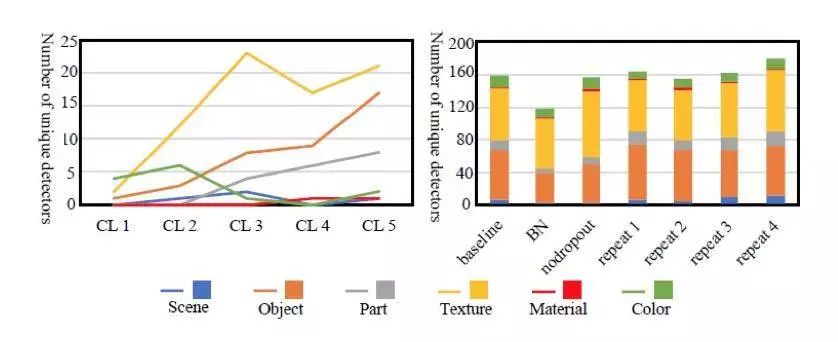
Semantic concepts at each level and under different training conditions
Network Dissection of Neuron Combinations
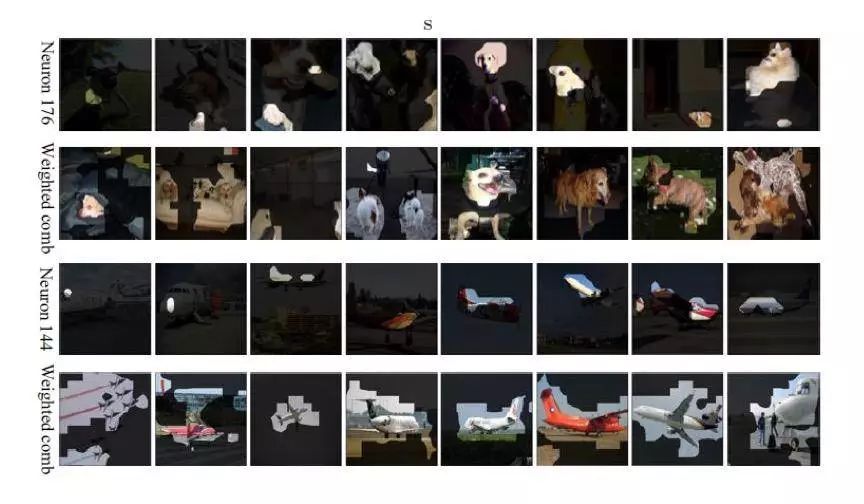
Network Dissection of Single Neuron and Neuron Combinations
The result of visualization by using a combination neuron is shown above. The first row and the third row are the result of the segmentation of a single neuron, while the second row and the fourth row are the result of the segmentation of neurons. As we have seen, the prediction mask is significant for most of the examples for the semantic visualization of "dog" and "aircraft" using the weighted combination method. This shows that although we can find neurons that correspond to a certain concept, these neurons do not optimally represent or fully cover this concept.
summary
Network Dissection is a unique visualization method used to interpret CNN that automatically assigns semantic concepts to internal neurons. By measuring the alignment between unsampled neuronal activation and semantically tagged real images, Network Dissection can visualize the types of semantic concepts represented by each convolutional neuron. Net2Vec confirms that CNN's feature representation is distributed. In addition, Network Dissection can be used to evaluate various training conditions, indicating that training conditions can have a significant impact on the interpretability of hidden neuron learning representations. This approach can be seen as another representative example of CNN visualization and CNN optimization.
Summary
In this article, we review the latest developments in CNN visualization methods. It presents four representative visualization methods from various aspects of structure, algorithm, operation and experiment to cover the latest results of CNN interpretable research.
Through the study of representative visualization methods, we can find that CNN does have a hierarchical feature representation mechanism that mimics the human visual cortex hierarchy. In addition, in order to reveal CNN's internal interpretation mechanism, visualization needs to adopt different analysis angles for different CNN components. In addition, better interpretability of CNN through visualization actually helps CNN optimization.
ZGAR AZ Vape Pods 5.0
ZGAR electronic cigarette uses high-tech R&D, food grade disposable pod device and high-quality raw material. All package designs are Original IP. Our designer team is from Hong Kong. We have very high requirements for product quality, flavors taste and packaging design. The E-liquid is imported, materials are food grade, and assembly plant is medical-grade dust-free workshops.
From production to packaging, the whole system of tracking, efficient and orderly process, achieving daily efficient output. WEIKA pays attention to the details of each process control. The first class dust-free production workshop has passed the GMP food and drug production standard certification, ensuring quality and safety. We choose the products with a traceability system, which can not only effectively track and trace all kinds of data, but also ensure good product quality.
We offer best price, high quality Pods, Pods Touch Screen, Empty Pod System, Pod Vape, Disposable Pod device, E-cigar, Vape Pods to all over the world.
Much Better Vaping Experience!


ZGAR AZ Vape 5.0 Pods,ZGAR AZ Vape Pods 5.0,ZGAR AZ Vape Pods 5.0 Pod System Vape,ZGAR AZ Vape Pods 5.0 Disposable Pod Vape Systems
ZGAR INTERNATIONAL(HK)CO., LIMITED , https://www.zgarvapor.com